
Stay informed and inspired in the world of AI with us.
 From Insights to Action: The Role of Predictive Analytics in Business Transformation
Predictive analytics uses historical data and techniques like statistical modeling and machine learning to predict future outcomes. It provides accurate forecasts, helping organizations predict trends and behaviors from milliseconds to years ahead. The global predictive analytics market was valued at 14.71 billion U.S. dollars in 2023 and is projected to grow from 18.02 billion U.S. dollars in 2024 to 95.30 billion U.S. dollars by 2032, with a compound annual growth rate (CAGR) of 23.1% during the forecast period (2024-2032). 80% of business leaders recognize that data is crucial for understanding operations, customers, and market dynamics. By combining historical data with predictive models, businesses gain a comprehensive view of their data, enabling real-time predictions and proactive responses to changing conditions. This article covers the basics of predictive analytics, how it works, its benefits, types of models, and key use cases in various industries. Predictive analytics enables organizations to identify patterns in data to detect risks and opportunities. By designing models that reveal relationships between various factors, organizations can assess the potential benefits or risks of specific conditions, supporting informed decision-making. Improved Decision-Making Provides detailed data-driven insights, such as customer buying patterns and market trends. Increased Efficiency Streamlines operations by identifying bottlenecks in production lines and optimizing supply chain logistics. Cost Reduction Identifies specific areas, like energy usage and inventory management, where costs can be cut without compromising the quality. Risk Management Detects potential risks, such as fraud in financial transactions or equipment failures in manufacturing. Enhanced Customer Experience Uses predictive insights to tailor marketing campaigns, recommend products, and customize services. Data Collection Historical data is collected from sources such as transaction records, customer interactions, and sensor data. Data Cleaning and Preparation The data is cleaned to remove errors, fill in missing values, and standardize formats, ensuring it is accurate and ready for analysis. Model Selection Based on the specific problem, an appropriate model, such as linear regression, decision trees, or neural networks, is selected. Model Training The chosen model is trained using historical data, enabling it to learn and identify patterns and relationships within the data. Model Testing The model is tested using a separate subset of data to evaluate its accuracy and performance, ensuring it can make reliable predictions. Deployment The trained model is deployed into the production environment to start making predictions on new incoming data. Monitoring and Refinement The model's performance is continuously monitored in real-time, and adjustments are made to improve its accuracy and adapt to new data trends. 1. Regression Models Regression models predict continuous outcomes based on historical data by identifying and quantifying relationships between variables. Walmart uses regression models to analyze past sales data, factoring in variables such as seasonal trends, holiday effects, pricing changes, and promotional campaigns. 2. Classification Models Classification models categorize data into predefined classes, making them useful for distinguishing between different types of data points. Gmail uses classification models to analyze incoming emails, considering sender address, email content, and user behavior to categorize emails as spam or regular messages. The model is trained on a large dataset of labeled emails to recognize patterns typical of spam. 3. Clustering Models Clustering models group similar data points together without predefined labels, helping to identify natural groupings within the data. Amazon uses clustering models to segment customers based on purchasing behavior, analyzing purchase history, browsing patterns, and product reviews. This allows Amazon to create targeted marketing campaigns with personalized recommendations and promotions for each customer group, such as frequent electronics buyers or regular book purchasers. 4. Time Series Models Time series models analyze data points collected or recorded at specific time intervals, useful for trend analysis and forecasting. Financial analysts at Goldman Sachs use time series models to analyze historical stock price data, including daily closing prices, trading volumes, and economic indicators, predicting its further movements for making informed investment decisions and recommendations. 5. Neural Networks Neural networks use layers of interconnected nodes to model complex relationships in data, particularly effective for pattern recognition and classification tasks. Google's DeepMind uses neural networks in its image recognition software to identify and classify objects within photos. For instance, in wildlife conservation projects, this software can analyze thousands of wildlife camera trap images, distinguishing between different species of animals such as lions, zebras, and elephants. 6. Decision Trees Decision trees use a tree-like model of decisions and their possible consequences, making them effective for classification and regression tasks. Netflix uses decision trees to recommend movies and TV shows by analyzing user data such as viewing history, ratings, and preferences. For instance, if a user likes action movies, the decision tree recommends similar action movies or related genres. Predictive analytics is transforming various industries by enabling organizations to make data-driven decisions and anticipate future trends. Here are some high-level examples of how predictive analytics is applied across different sectors. The Mayo Clinic uses predictive analytics to identify patients at high risk for chronic diseases such as diabetes and heart disease. By analyzing EHR data, genetic information, and lifestyle factors, the clinic can offer early interventions and personalized treatment plans. Another possible applications of predictive analytics in healthcare include: 1. Disease Prediction Identifies high-risk individuals for diseases like diabetes and cancer by analyzing patient history, genetics, and lifestyle to enable early intervention and reduce treatment costs. 2. Patient Readmission Estimate readmission likelihood, allowing targeted interventions like enhanced discharge planning and follow-up care. 3. Resource Management Optimizes patient admissions, staff schedules, and medical supplies. 4. Personalized Medicine Enables personalized treatments and better results by analyzing genetic data and treatment responses. 5. Clinical Decision Support Enhances diagnosis and treatment by providing evidence-based recommendations. 6. Population Health Management Identifies health trends, helping public health organizations develop targeted interventions and plan for disease outbreaks. Financial analysts at Goldman Sachs use time series models to analyze historical stock price data, including daily closing prices, trading volumes, and economic indicators, predicting its further movements for making informed investment decisions and recommendations. Here are more possibilities for predictive analytics in financial area: 1. Credit Scoring Predictive analytics assesses creditworthiness by analyzing credit history, transaction patterns, and financial behavior. 2. Fraud Detection Identify suspicious transactions and patterns, allowing to detect and prevent fraud in real-time. 3. Investment Strategies Helps to forecast market movements and optimize asset allocation by analyzing market trends, economic indicators, and historical data. 4. Risk Management Forecasts potential market, credit, and operational risks, helping to develop mitigation strategies, ensure regulatory compliance, and maintain stability. 5. Loan Default Prediction Estimate loan default likelihood by analyzing borrower profiles and economic conditions. 6. Market Trend Analysis Provides insights into market trends by analyzing historical data and economic indicators, helping to anticipate market shifts. Spotify applies predictive models to identify users who are likely to cancel their subscriptions. By analyzing listening habits, subscription history, and engagement metrics, Spotify can implement retention strategies to reduce churn. Their robust music recommendation system is also wide-known. Other opportunities include: 1. Customer Segmentation Groups customers based on behavior and preferences, enabling tailored marketing campaigns that increase engagement and conversion rates. 2. Churn Prediction Identify customers likely to leave, allowing companies to implement retention strategies and improve customer loyalty. 3. Sales Forecasting Provides accurate sales predictions, helping businesses manage inventory effectively and optimize marketing strategies. 4. Lead Scoring Evaluates and ranks leads based on their likelihood to convert, enabling sales teams to prioritize high-potential prospects and improve conversion rates. 5. Customer Lifetime Value (CLV) Prediction Estimate the future value of customers by analyzing purchase history and behavior, helping businesses focus on high-value customers and tailor long-term engagement strategies. 6. Campaign Optimization Assesses the effectiveness of marketing campaigns by analyzing response data and consumer interactions. Walmart uses predictive analytics to analyze purchasing data, identifying products that are likely to be popular during different seasons, such as summer apparel or winter holiday decorations. This allows Walmart to optimize inventory levels, ensuring that high-demand items are well-stocked and reducing the risk of stockouts or excess inventory. Here are more opportunities for predictive analytics in retail: 1. Demand Forecasting Predictive analytics forecasts future product demand, optimizing inventory levels to reduce stockouts and overstock situations. 2. Personalized Marketing Analyzes customer data to create tailored marketing campaigns, targeting customers with relevant offers and recommendations. 3. Price Optimization Determines optimal pricing strategies by analyzing market trends, competitor prices, and customer behavior. 4. Customer Segmentation Groups customers based on purchasing behavior and preferences for targeted marketing strategies and personalized shopping experiences. 5. Inventory Management Predictive analytics optimizes inventory management by forecasting demand and analyzing supply chain data. 6. Store Layout Optimization Analyzes shopping patterns and customer flow to optimize store layouts. Toyota implements predictive analytics to ensure product quality by analyzing real-time data from sensors on the production line. This includes data on temperature, pressure, and machinery vibrations. By monitoring these parameters, Toyota can detect early signs of equipment malfunctions or deviations from quality standards, allowing for immediate corrective actions. More opportunities for predictive analytics in manufacturing: 1. Predictive Maintenance Predictive analytics identifies potential equipment failures before they occur, enabling timely maintenance and reducing downtime. 2. Quality Control Monitors production processes to detect anomalies in real-time, ensuring consistent product quality. 3. Supply Chain Optimization Enhances supply chain efficiency by predicting demand, optimizing inventory levels, and reducing lead times. 4. Production Planning Forecasts production requirements and schedules, optimizing resource allocation and minimizing waste by aligning production output with market demand. 5. Energy Management Analyzes energy consumption patterns to optimize usage, reduce costs, and improve sustainability. 6. Workforce Management Predictive analytics forecasts labor needs based on production schedules and demand fluctuations. Our predictive analytics solutions have been used in different industries, showing how powerful and flexible machine learning can be in solving complex problems. Here are some examples that highlight the impact of our work. We developed a COVID-19 prediction tracker to calculate the risk of infection and the potential number of patients in specific locations within Israel. Our client aimed to help flatten the COVID-19 curve in Israel, a leader in vaccination efforts. We were tasked with predicting the spread and infection risk of COVID-19, facing challenges such as rapid disease spread, environmental changes, and the need for precise predictions at the city district level. Having neural networks and deep learning techniques in our arsenal, we took on the challenge: Recurrent Neural Networks (RNN) We used an artificial RNN, specifically long short-term memory (LSTM), to handle the dynamic nature of the pandemic and preserve long-term memory for time-series data related to infection rates. Data Normalization We managed to normalize data for both the beginning of the epidemic and real-time predictions, addressing statistical errors at different epidemic stages. Embedding Layers Added to the model to compress and represent city-specific data accurately, enabling the ML model to understand and predict interactions within the data. Risk Scale Development Created a risk scale (rating from 1 to 8) to detect the chances of infection in specific locations, using confirmed COVID-19 data and social behavior data. The solution provided precise predictions for epidemic development across Israel, offering accurate forecasts for around 300 towns and city districts. Specifically, the model accurately predicted infection rates with an error margin of less than 5%. The prediction accuracy improved public health responses, reducing infection rates by 20% in highly targeted areas We created a marketing forecasting solution for real estate businesses, increasing house sales by 16.5 times per month. One of our American real estate clients faced the problem of low sales. To address this, they decided to boost the number of estate buyers through ML-driven targeted advertising. We used historical sales data on transactions, loans, and estimated property values to build an ML model for highly targeted advertising: Data Usage Used ATTOM datasets (US nationwide property data) related to ownership status and seasonality to create a prediction model that accounted for sales fluctuations. Model Parameters Considered period of ownership, equity position, and actual residence for precise ad targeting, leading to significant sales growth. Enhanced Targeting Improved targeting with actual residence data, achieving remarkable increases in house sales. Robust Model Development Ensured the model's robustness and traceability using a decision tree classifier. The predictive model greatly improved ad targeting, increasing sales conversion by 16.5 times. To enhance personalized care, a client aimed to develop a treatment prediction solution using patient data from electronic health records (EHR) and electronic medical records (EMR), including detailed medical histories, genetic information, and lifestyle factors. The traditional “one-size-fits-all” treatment approach ignores crucial factors like age, gender, lifestyle, previous diseases, comorbidities, and genetics, making it hard to select optimal treatment plans. We sought to create a method to predict treatment outcomes using personalized data and machine learning (ML): Data Transformation Patient data, including medical histories, genetic information, and lifestyle factors, was standardized into a machine-readable format Cohort Definition We categorized treatment outcomes into "positive," "negative," and "no progress" classes. Model Development We developed and trained a machine learning algorithm using the processed patient data such as age, gender, medical history, genetic markers, and lifestyle habits. Implementation Integrated the trained model into the clinical workflow for ongoing predictions, providing real-time insights into potential treatment outcomes for individual patients. By leveraging detailed patient data, including medical histories, genetic information, and lifestyle factors, we achieved treatment success rates increasing by 25%, adverse reactions decreasing by 30%, and patient satisfaction scores improving from 80 to 96. Our ML service has two main purposes: forecasting and determining influencing factors on target data. As a forecasting tool, our autoML solution is versatile enough for other tasks like predicting sales or expenses. As driver service, the solution lets users test external and internal factors that influence their target data. The solution applies a pool of diverse models to the input data and selects the best one based on performance metrics. This approach ensures broad applicability and high accuracy. Key aspects of the technical implementation include:
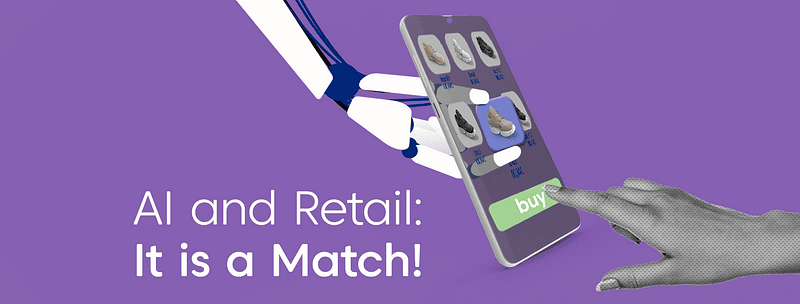 AI and Retail: It is a Match!
Why use AI in Retail? (Plus Best Practices) Artificial Intelligence (AI) and retail are a good fit. The COVID-19 pandemic has accelerated digital transformation worldwide and is whipping up different business verticals to adopt various AI technologies. As per the UNCTAD survey, more than half of consumers of the emerging and developed economies are shopping online. The part of AI in the retail market in 2020 was valued at USD 1,80 billion and is expected to reach USD 10,90 billion at a CAGR of 35% by 2026. It seems like it is high time for going big or going home for retailers. The latest AI technologies are already helping early adopters with managing products and supply chains, improving operational efficiency, and meeting the expectations of the more demanding consumers. We are presenting a close-up on how to benefit from these changes. Read on to find out the best practices of using AI in retail and e-commerce in 2021. Consumers are going deeper in digital than ever before. The brightest example is Amazon, which has increased its profit by 200% since the beginning of the COVID-19 pandemic. It made Jeff Bezos 80% richer at the beginning of 2021 than before the pandemic. Apart from e-commerce, consumers tend to choose the internet for news, information related to health issues, and entertainment, leaving more data online. This fact implies two principal tasks: meeting the growing and ever-changing demand of consumers online and discovering valuable data-driven insights. Simultaneously, different generations of customers expect a personal touch from the markets in the time of uncertainty. For example, the younger generation recognizes the need to save more money than 55+ years old customers (43% vs. 20% correspondingly according to the Kantar research). It means that retailers should listen to their consumers and choose the appropriate pricing strategy. At the same time, the younger generation is far more open to reward brands providing excellent customer experience more than Boomers (44% vs. 31%, correspondingly). Thus, chatbots, recommender systems, and data-driven business intelligence enter the picture. When customers are spending more of their time online and are interacting with various brands each day, investing in qualitative customer experience is crucial. Far-flung supply chains are vulnerable, and it is a fact. While some groups of society are undergoing vaccination against coronavirus and the global economy starts recovering, retailers are still adapting their supply chains to the new normal. And this new normal implies mobility restrictions, closing the factories for quarantines, and slowing down the logistics flows. Though it is still hard to assess the impact of the corona crisis on the global economy, the one is clear — the recovery lasts long. For example, one of the global electronics manufacturers’ revenue decreased to 66% after the series of earthquakes in Japan in 2016. Recovery time for this case reached one year. Hence, reducing the level of dependency on far-flung supply chains and developing resilience with the help of AI comes in handy as never before. Per Bain & Company research, flexible and resilient supply chains are accelerating revenue growth, improving customer satisfaction, increasing savings and cash flow, and minimizing risks. See the infographics below for more details. Resilient supply chains competitive advantage So, how exactly the supply chain can develop resilience with AI under uncertainty? As per research, you should invest in these five capabilities to build a resilient supply chain, counting on the latest technologies:
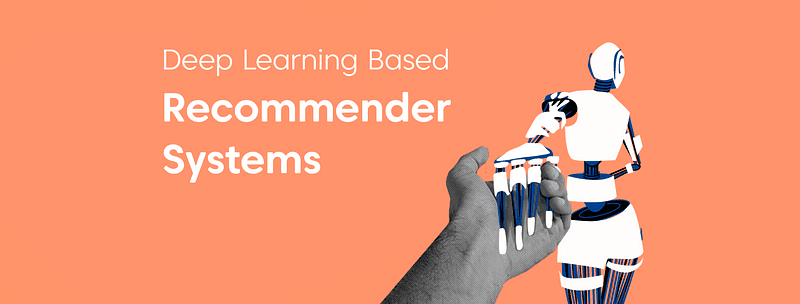 Deep Learning Based Recommender Systems
Recommender systems are lifesavers in the infinite seething sea of e-commerce, improving customer experience. Recommender engines are eliminating the tyranny of choice, smoothing the way for decision-making, and boosting online sales. Moreover, ubiquitous AI technologies are sneaking into e-commerce, too, not only solving the problems of irrelevant recommendations but predicting the customer’s next steps. In light of the pandemic’s impact, online sales are projected to grow twice in the next three years. Under those circumstances, businesses should ensure a perfect customer experience with precise recommendations to stand out. Read on to find out how recommender systems work, the pros and cons of these recommenders, and which algorithms stand behind them. Not surprising that media, retail, job listings, education, real estate, and travel companies are already using deep learning. It brings a killer feature for predicting ratings, defining the following items in the basket, and providing a personalized customer experience. For instance, 80% of content watched on Netflix, and 60% of videos on YouTube came from recommendations. First, learn how traditional recommendation systems work before diving into the complex deep learning based ones. Traditional recommender systems (RSs) include content-based and collaborative filtering (CF) systems grounding their recommendations on historical interactions and user/item attributes. Content-based recommendations are mainly drawn on the user’s item and profile features, and CF seeks a similar audience’s preferences. Furthermore, the CF approach is divided into memory-based (using the nearest neighbor classification method) and model-based (includes machine learning and data mining techniques). Also, the hybrid approach reaps the harvest of both content-based and collaborative filtering methods. At the same time, these systems have their constraints. For example, the cold start problem is an issue of irrelevant recommendations for a new user who still has performed few system interactions. Also, one can face a data sparsity problem. Think of millions of items on Amazon and a small amount of actual item-user interactions per typical user. We have explained all the magic and constraints of traditional RSs before. Check out “Inside Recommendations: How a Recommender System Recommends“ for details. In general, deep learning (DL) is the subfield of ML learning from multiple levels of data representations and abstractions. Some tech companies are already using DL systems drawn on different neural networks (NNs) to make the customer experience better. For instance, YouTube, eBay, Yahoo, and Twitter choose deep neural networks (DNNs), while Spotify prefers convolutional neural networks (CNNs). Meanwhile, DNNs and CNNs are only a few types of networks applied, as we can continue this list of deep learning algorithms. Why do we need a range of them? The answer is related to the business domain, particular task, or recommender scenario. Owing to the use case, one might leverage different NNs or even a hybrid approach to DL-based recommendation systems. The principal feature that differs DL-based recommender systems from traditional ones is coping with complex interaction patterns and precisely reflecting the user’s preferences. Content-based and collaborative filtering models are relatively linear systems that cannot deliver such deep user insights. To explain how each particular RS operates and what kind of benefits it brings, we have developed an overview of the most popular techniques. Typical CNN architecture Convolutional Neural Networks (CNNs) are a good fit for unstructured multimedia data processing given effective feature extraction. They are processing the data like image, text, audio, and video. CNNs help to eliminate the cold start problem or empower traditional systems like collaborative filtering. This feature is critical for e-commerce, as most customers conclude their decisions by assessing goods’ visuals. CNNs is also an option for non-Euclidean data (non-ordinal or hierarchical data) like social networks, protein-interaction networks, and knowledge graph. For instance, this kind of system could be applied to Pinterest recommendations. Unfolded basic recurrent neural network Recurrent Neural Networks (RNNs) could become a killer feature for sequential data processing, defining temporal dynamics of interactions and sequential user behavior patterns. For example, YouTube recommends content for a particular time of the day or predicts the next piece of content drawn on the already watched one. The majority of websites today do not require a user to log in for navigation. In other words, it means no access to customers’ long-term interests or consumption habits. Meanwhile, a cookie mechanism (i.e., session mechanism) can solve this task. RNNs can help build session-based recommendations without user identification information or even predict what users can buy next based on their click history. Restricted Boltzmann Machine Restricted Boltzmann Machine (RBM) belongs to the most old-fashioned RSs rooted from 2007 but is still in play. Significantly, RBM, combined with collaborative filtering, won the Netflix Prize for better recommendations on the streaming platform in 2009. Moreover, RBM-based techniques are still scalable to large data sets and producing high-quality recommendations of items per particular user. Autoencoder basic neural network In essence, an autoencoder is a neural network that reconstructs its input data in the output layer. It has an internal hidden layer that describes a code used to represent the input. The autoencoder consists of two main parts. They are an encoder that maps the information into the code and a decoder that maps the code to reconstruct the input. The beauty of autoencoder is in its agility in data dimensionality reduction, data reconstruction, and feature extraction. Attention mechanism derives from computer vision and natural language processing domains. Simply put, it is a vector of importance weights that predicts the next item. The attention mechanism is based on correlation with other elements (e.g., a pixel in the image or the next word in a sentence). In essence, human visual attention stands as a source of inspiration for this technique. The system can “focus” on a particular element to make its following recommendation. Illustration of the self-attention module. The input is the embedding matrix of the latest interacted L items, and the output is the self-attentive representations. Applying an attention mechanism to the recommender system can help filter out uninformative content and choose the most representative items. It provides good interpretability at the same time. It is also possible to integrate neural attention models with DNNs or CNNs. When it goes about complexity or numerous training instances (an object that an ML model learns from), deep learning is justified for recommendations. While neural network models show higher results, it is also possible to tune up conventional RSs with neural architecture to be on par. However, it needs some extra manipulations. To define when you need to opt for DL based RS, keep in mind the following advantages and drawbacks: Benefits of DL based recommender systems Are there any drawbacks of applying a complex technique like DL for recommender systems? The answer is yes. Depending on the way of using, some potential limitations could enter the picture: Flaws of DL based recommender systems Deep learning-based recommender systems outperform traditional ones due to their capability to process non-linear data. Non-linear transformation, representation learning, sequence modeling, and flexibility are the principal benefits of applying DL for recommendations. Moreover, DL techniques could be tailored for specific tasks. For example, CNNs are a good fit for non-Euclidean data, and DNNs are for sequential data processing. Autoencoder helps to secure data dimensionality reduction, and neural attention-based systems are suitable for filtering needed data and choosing the most representative items.
 Modern stores: Indoor Analytics at retailers’ services
To make retail trade more effective, owners wished for centuries to understand what the clients want and what they see when they enter the shop. A lot was written and done on increasing the attractiveness of the premises and putting the goods in a particular fashion. Both owners and assistants were trying to develop their designer skills, good eye for clients, and intuition. It is at present, that the development of AI and Machine Learning made it possible for good analytics and statistical data to come to help when pure talent is not enough. Indoor analytics, as a part of AI, tells more about customers’ behavior: where they go at stores, what they see and what remains a blind spot, how much time they spend choosing the goods, and what emotions they experience. Indoor Analytics provides information on visitor numbers, the areas they visit, and their length of stay. An indoor map built on the data may depict customer flows and a heat map will provide insights into where they spend the most time. In this way, it is possible to identify spots within the premises that do not receive enough attention or that simply lie away from the conventional visiting route and optimize the layout accordingly. Apart from the evident benefit of placing the goods and promotions along the main route, this solution can help optimize human resources planning by analyzing customer numbers in different zones and at different times. Besides, visiting time tracking can give valuable insights into human behavior and the decision-making process and predict whether the pop-in visitor has the potential to become a loyal client. There are three main approaches to obtaining the necessary data. Wi-Fi networks Customers’ smartphones provide the signals needed to track where people go in closed spaces. All you need is to record this information is the right radio sensor technology like a WiFi infrastructure and a couple of WiFi access points. Of course, each customer has the option to refrain from Indoor Analytics by switching off the WiFi feature on their phone while they are in the store. However, in most cases, customers themselves bring the main tool for using this type of customer flow study with them. Beacons Bluetooth beacons are tiny radio transmitters that send out signals in a radius of 10–30 meters in interior spaces. They have a number of obvious benefits: they are cheap, easy to install, determine positions accurately up to 1 meter, and are supported by many operating systems and devices. Besides, beacons can be used for both client-based and server-based applications. For example, they enable indoor navigation for airline passengers using the app — cross-platform and with an accuracy of up to 1 meter. The server-based beacon tracking of persons or goods is only possible with third-party components (e.g. Infsoft Locator Node, Cisco, Aruba). Beacons (the most common types are the iBeacon and Eddystone) are the best choice for projects that demand high accuracy and want to include Apple devices. Security Cameras Existing security cameras have all the required information for further processing. All we need is to get the videos from cameras, visualize the processed images in a 2D top-down view, and calculate the statistics. The advantages of this method are quite obvious: it is cost-efficient because it does not require any additional hardware, and it is customers-independent so that you don’t have to rely on smartphones which potentially increases the accuracy of human flow metering covering the groups of customers who do not use — or are unwilling to use the store’s WiFi. On top of this, information from cameras can provide insights into the demographic characteristics of the customers as well as their emotions during shopping and their reactions to changes in the store layout. One of the cornerstones of Indoor Analytics is a special anonymization process that guarantees that the recorded information cannot be related to individuals in any way. All information is immediately anonymized and encrypted on a secure, on-site server in full compliance with personal data protection laws. Therefore, systems do not have access to personal information, so the customer’s right to privacy is not infringed. All solutions take care to anonymize and record customer flows in the store and then use big data applications to provide informative analyses that can be used in management decisions. Whichever approach you choose, it will soon transform your store into a better place for customers and give you the satisfaction of finally knowing what they want.
